| Chapter 9. Evaluate | ||
|---|---|---|

|
 |
|
| Chapter 9. Evaluate | ||
|---|---|---|
|
|
|
|
Table of Contents
This chapter describes how Klaros-Testmanagement can be used to gather information about the selected project and evaluate its data.
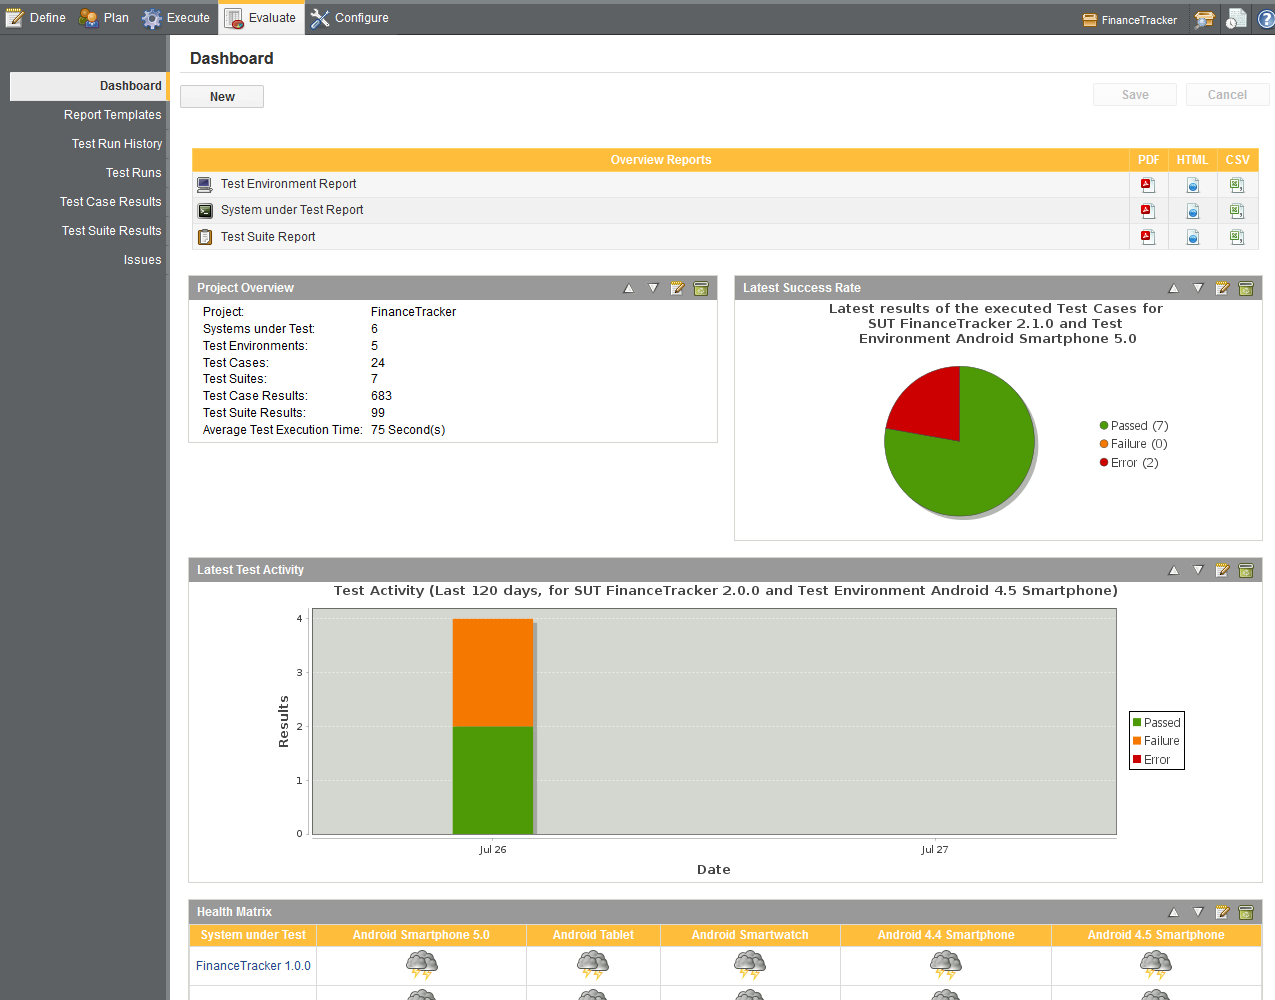
The dashboard shows basic statistics about the active project and provides the links to the overview reports. An example of a dashboard is shown in Figure 9.1.
The upper part of the dashboard shows a table with the available overview reports. The following three types of reports are available:
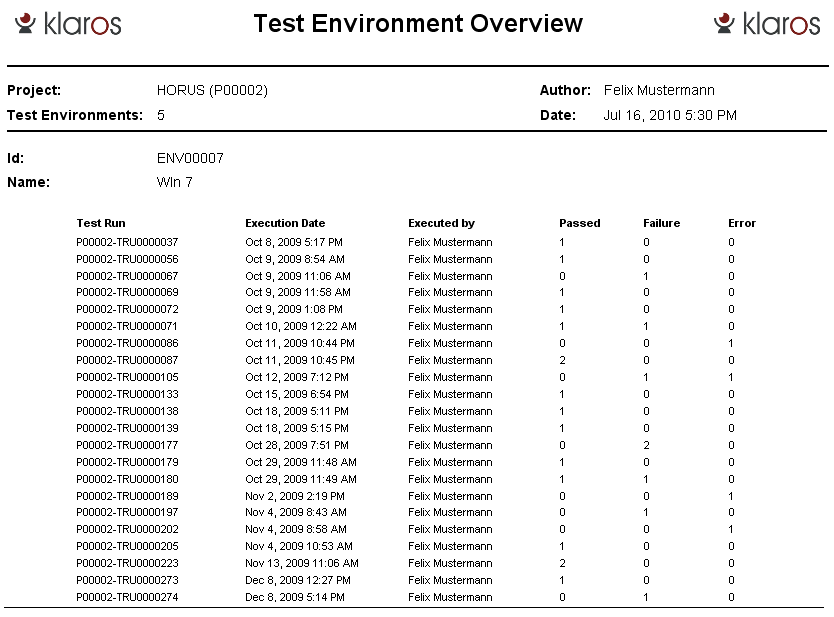
Test Environment Overview
The Test Environment Overview report shows the test runs that have been executed in each test environment containing the execution date and quantity of success, failure and error results. An example of the report is shown in Figure 9.2.
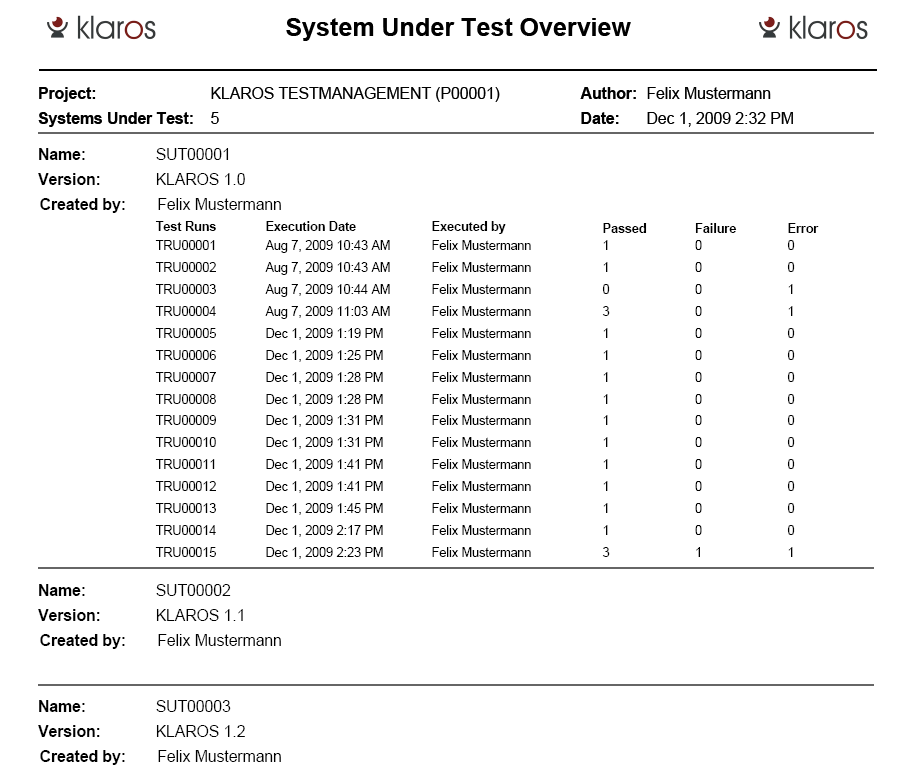
SUT Overview
The SUT Overview report shows the test runs that have been executed for a system under test containing the execution date and quantity of success, failure and error results. An example of the report is shown in Figure 9.3.
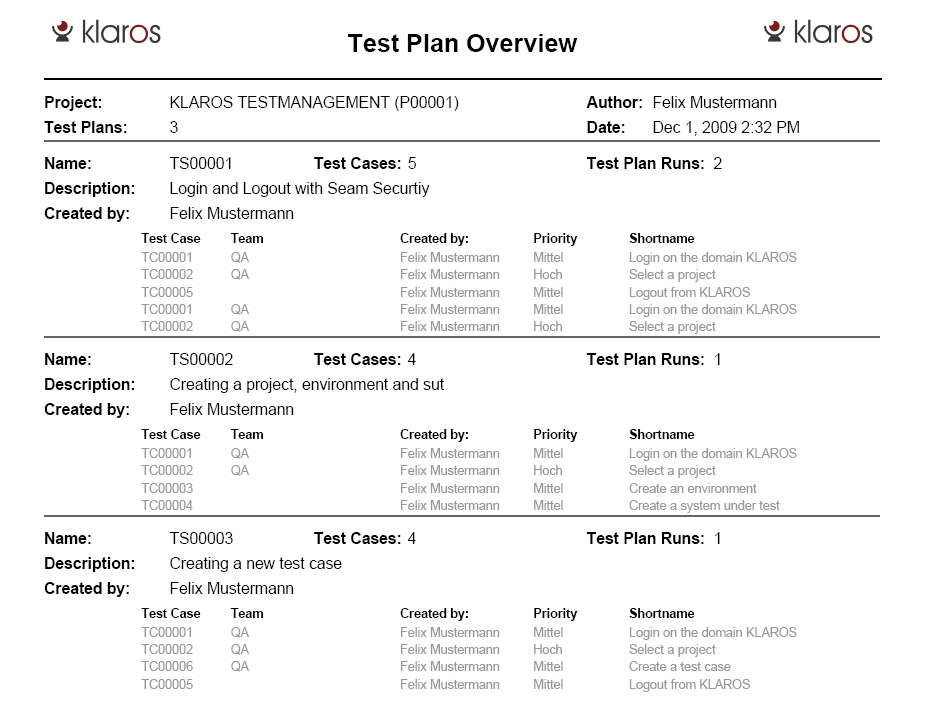
Test Suite Overview
The Test Suite Overview report shows the selected test suite, containing its test cases, description, how many times it was executed and with what results. An example report is shown in Figure 9.4.
The reports can be generated in three different file formats:
HTML
CSV
Clicking on a file type icon generates the report will in the selected format.
The dashboard is a container for multiple reports. Each report has the same
structure: It consists of a title bar and an area in which the report is displayed.
The title bar of the report contains the reports name, and an edit button (
![]() ).
When the edit button is clicked, the parameters of the report can be configured in the
resulting dialog.
The changes in the configuration can be applied to the report by clicking the
button or discarded by clicking the
button.
Additionally the name of the report can be configured by clicking on the name
in the title bar of the report.
).
When the edit button is clicked, the parameters of the report can be configured in the
resulting dialog.
The changes in the configuration can be applied to the report by clicking the
button or discarded by clicking the
button.
Additionally the name of the report can be configured by clicking on the name
in the title bar of the report.
The configured dashboard can be persisted by clicking the button in the upper right corner of the dashboard. If the button is pressed, the changes in the configuration of the dashboard are discarded.
All reports can show data from the currently selected project.
![]() Feature only available in Klaros-Testmanagement Enterprise Edition
Feature only available in Klaros-Testmanagement Enterprise Edition
In addition to the above, reports in the Klaros-Testmanagement Enterprise Edition can display data from non-active projects, selected in the report settings.
Klaros-Testmanagement Community Edition comes with three predefined reports:
The Project Overview Report
The Latest Success Rate Report
The Test Activity Report
These reports are described in the following sections.
![]() Feature only available in Klaros-Testmanagement Enterprise Edition
Feature only available in Klaros-Testmanagement Enterprise Edition
In addition, Klaros-Testmanagement Enterprise Edition contains three additional reports:
The Project Health Report
The Test Progress History Report
The Test Progress Report
These reports are also described in the following sections.
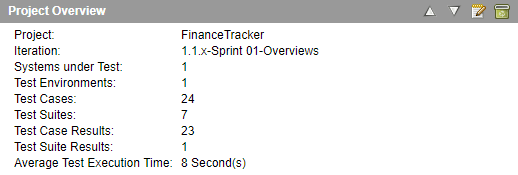
The Project Overview Report shows the main properties of a project listed in a table. The report shows:
The number of defined systems under test
The number of defined test environments
The number of test cases
The number of test suites
The number of test case results
The number of test suite results
The average of the number of test case steps
The average of the test case execution times
The only configurable property of the report is its display name.
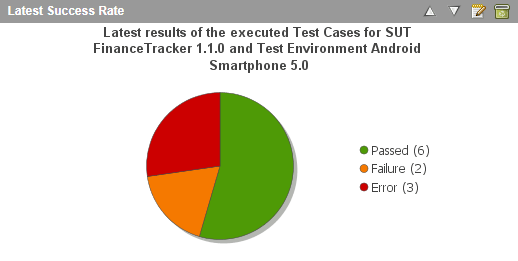
The Latest Success Rate report shows the ratio of the newest test runs for a selected combination of system under test and test environment.
The configurable properties of the report are:
The display name of the report.
A boolean value indicating that this report always uses the active project (Klaros-Testmanagement Enterprise Edition only).
Alternatively, the fixed project that this report will display.
A boolean value indicating that this report always uses the active iteration (if available).
Alternatively, the fixed iteration that this report will display (if available).
The system under test to display.
The test environment to display.
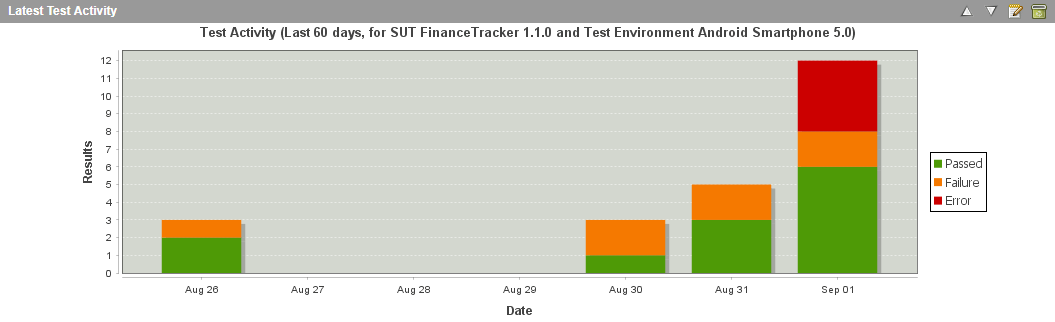
The Test Activity Report shows the count and the results of the test runs for a selected combination of system under test and test environment in a selected period of time as a histogram.
The configurable properties of the report are:
The name of the report.
A boolean value indicating that this report always uses the active project (Klaros-Testmanagement Enterprise Edition only).
Alternatively, the fixed project that this report will display.
A boolean value indicating that this report always uses the active iteration (if available).
Alternatively, the fixed iteration that this report will display (if available).
The system under test to display.
The test environment to display.
The time period in days.
![]() Feature only available in Klaros-Testmanagement Enterprise Edition
Feature only available in Klaros-Testmanagement Enterprise Edition
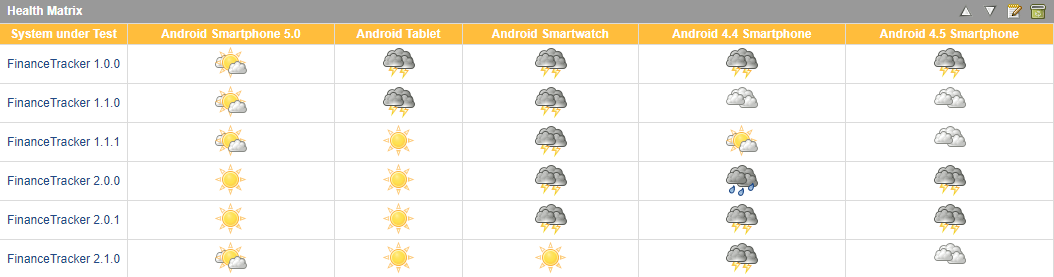
The Project Health Matrix Report shows the project health as weather icons for each defined test environment and system under test in a matrix. The icons are calculated from the execution and success rate in each category which is shown in detail in a tool tip of each icon.
The configurable properties of the report are:
The name of the report.
A boolean value indicating that this report always uses the active project.
A boolean value indicating that this report always uses the active iteration (if available).
Alternatively, the fixed iteration that this report will display (if available).
Alternatively, the fixed project that this report will display.
The execution rates assigned to the different health categories.
The success rates assigned to the different health categories.
![]() Feature only available in Klaros-Testmanagement Enterprise Edition
Feature only available in Klaros-Testmanagement Enterprise Edition
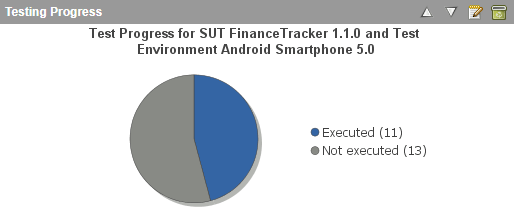
The Test Progress Report shows the rate of executed vs. defined tests of a project for a given test environment and a system under test.
The configurable properties of the report are:
The name of the report.
A boolean value indicating that this report always uses the active project.
Alternatively, the fixed project that this report will display.
A boolean value indicating that this report always uses the active iteration (if available).
Alternatively, the fixed iteration that this report will display (if available).
The system under test to display.
The test environment to display.
![]() Feature only available in Klaros-Testmanagement Enterprise Edition
Feature only available in Klaros-Testmanagement Enterprise Edition
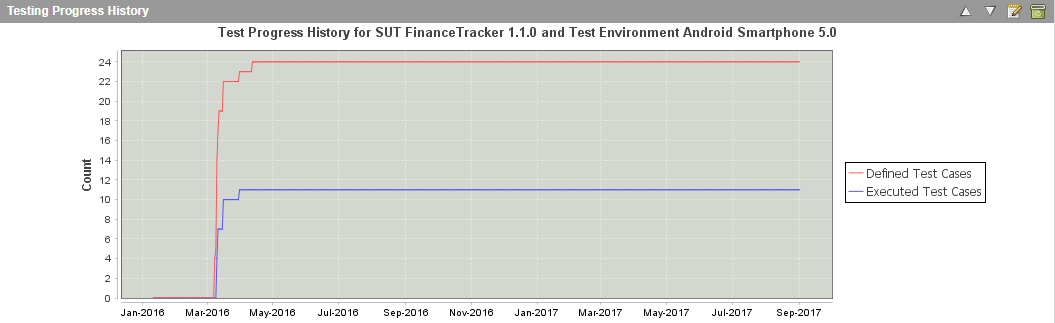
The Test Progress History Report shows the rate of executed vs. defined tests of a project for a given test environment, system under test and time period.
The configurable properties of the report are:
The name of the report.
A boolean value indicating that this report always uses the active project.
Alternatively, the fixed project that this report will display.
A boolean value indicating that this report always uses the active iteration (if available).
Alternatively, the fixed iteration that this report will display (if available).
The system under test to display.
The test environment to display.
The time period of the report.
|
|
|
|
| 8.8. Creating Review Jobs |  |
9.2. Report Templates |