| Chapter 9. Evaluate | ||
|---|---|---|

|
 |
|
| Chapter 9. Evaluate | ||
|---|---|---|
|
|
|
|
Table of Contents
This chapter shows how data and results can be evaluated, that were gathered during testing. It explains how the dashboard works and how it can be configured, how reports are configured and rendered and how issues can be created in a connected issue management system.
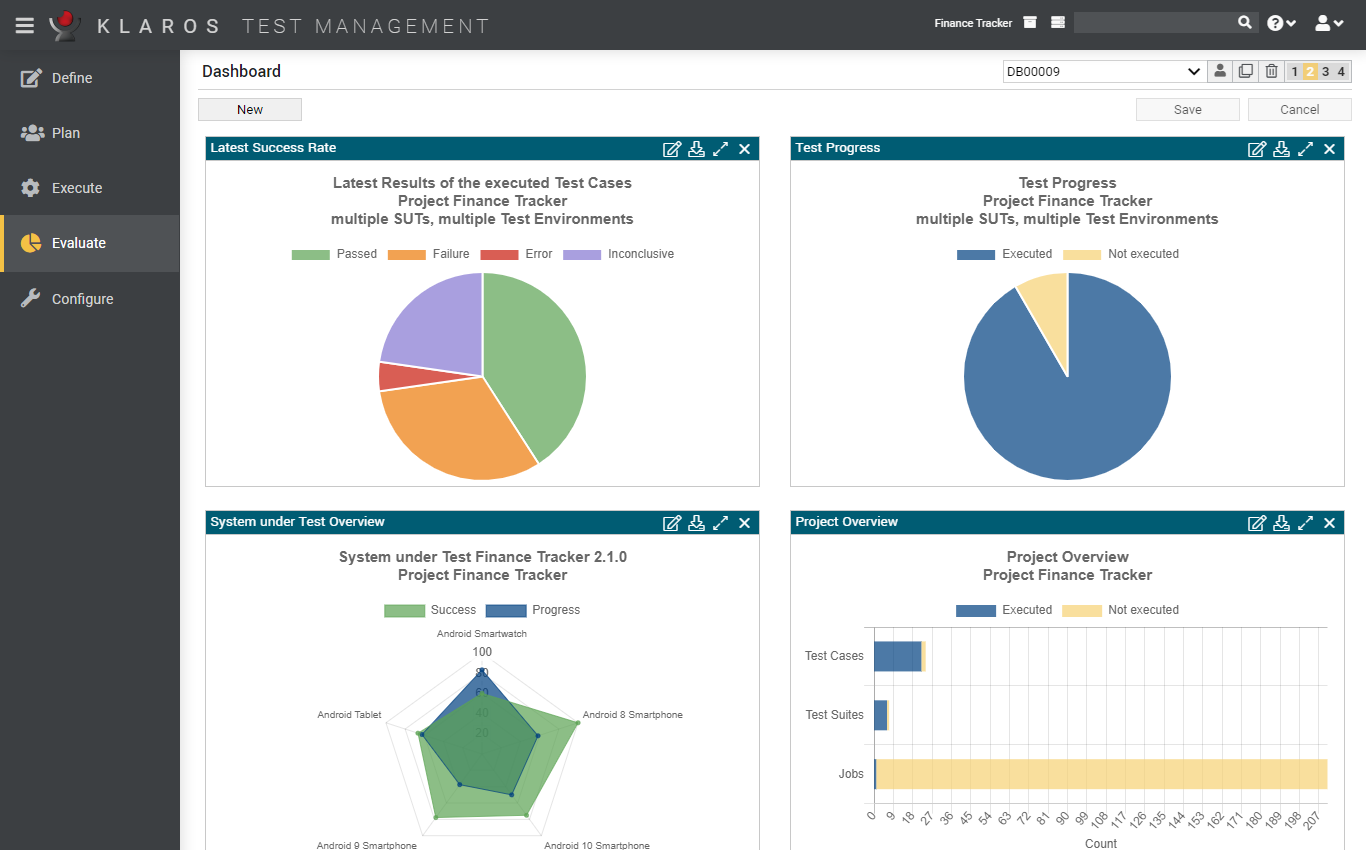
A dashboard is an overview page for configurable reports displayed as a chart. Dashboards can be individually configured and shared with or blocked for other users. Each user can configure any number of dashboards. An example of a dashboard is shown in Figure 9.1.
Users can switch between dashboard at any time. The drop-down list on the upper right page shows all available dashboards (private and shared by other users). Next to this drop down list are several icons:
The number of reports that should be shown in a row can be set with the numbered buttons (1 to 4) on the upper right. The currently selected number of reports per row is marked in orange. Reports can be moved to another position by dragging and dropping.
All dashboard reports have the same structure: they consist of a title bar and the area where the chart is displayed. The title bar contains the name of the report and several icons:
Upon the first start of Klaros-Testmanagement, a default dashboard with three predefined reports is created. This dashboard is accessible by all users an is automatically displayed to each new user. Administrators can change the default dashboard by setting any other dashboard as the default dashboard.
![[Note]](images/note.png) |
Note |
|---|---|
|
There is always only one default dashboard. If a new default dashboard is set, the previous default dashboard loses this status. |
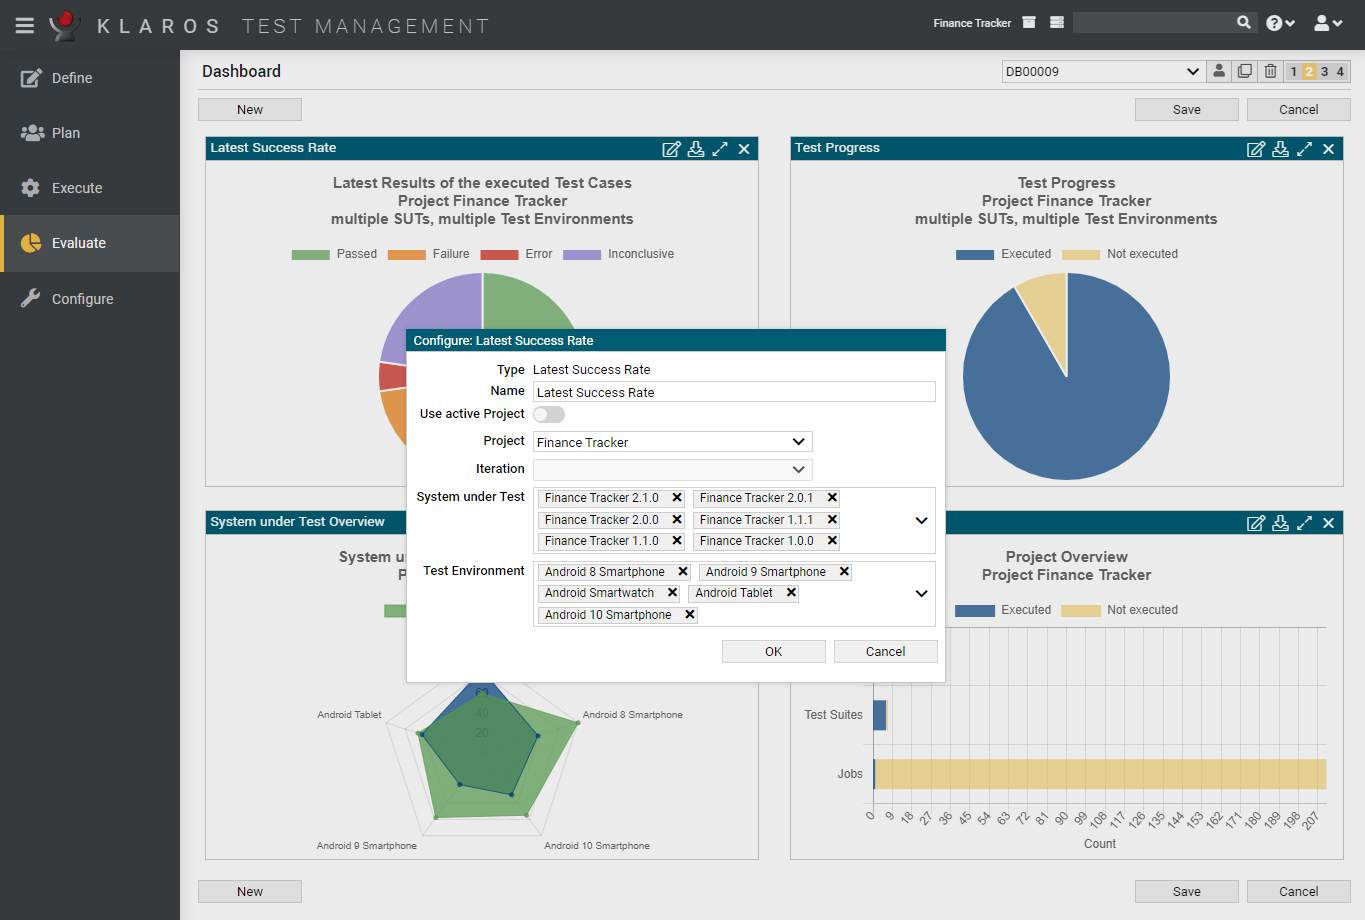
Clicking the icon opens up a dialog that shows all configurable parameters of the report as well as the report type (which cannot be changed). Changes can be applied to the report by clicking the button or discarded by clicking the button.
All reports initially show data from the currently selected project.
In addition to the data of the active project, data of specific projects can also be displayed in the Klaros-Testmanagement Enterprise Edition.
Klaros-Testmanagement Community Edition contains three report types:
![]() Only available in Klaros-Testmanagement Enterprise Edition
Only available in Klaros-Testmanagement Enterprise Edition
The Klaros-Testmanagement Enterprise Edition also contains four additional report types:
These reports are described in detail in the following sections.
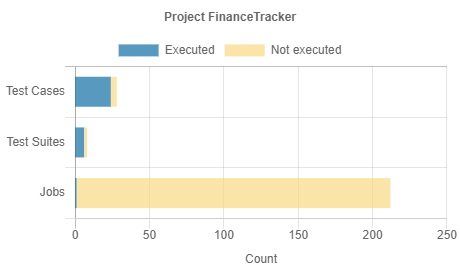
The Project Overview report shows several metrics of a single project in a chart.
This report displays the following metrics:
The following properties of the “Project Overview” report diagram are configurable:
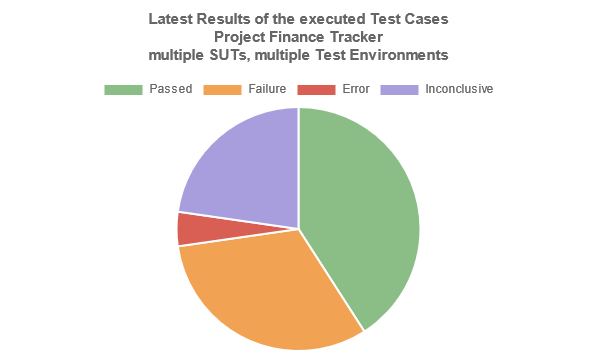
The Last Success Rate report shows the latest results of executed test cases for the selected combination of system under test (one or more) and test environment (one or more).
The following properties of the “Latest Success Rate” report diagram are configurable:
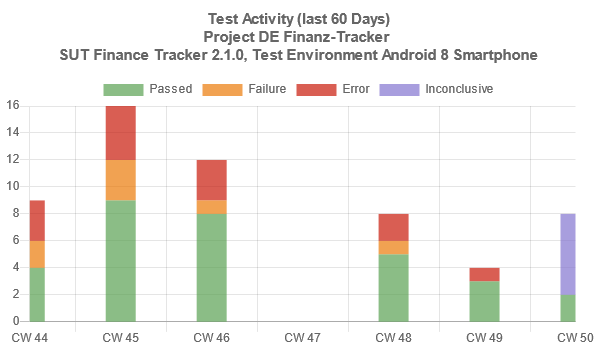
The Test Activity Report shows the test case results for a selected combination of system under test and test environment in a selected period of time as a histogram.
The following properties of the “Test Activity” report diagram are configurable:
![]() Only available in Klaros-Testmanagement Enterprise Edition
Only available in Klaros-Testmanagement Enterprise Edition
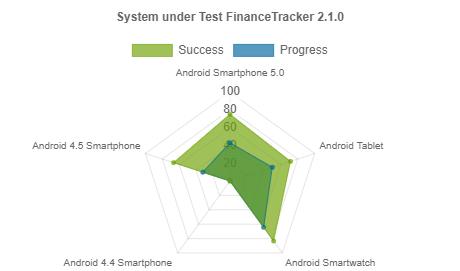
The System under Test Overview Report shows the success and progress rate of test environments under a single system under test in a radar chart. If fewer than three test environments are configured, a bar chart will be displayed instead.
The following properties of the “System under Test Overview” report diagram are configurable:
![]() Only available in Klaros-Testmanagement Enterprise Edition
Only available in Klaros-Testmanagement Enterprise Edition
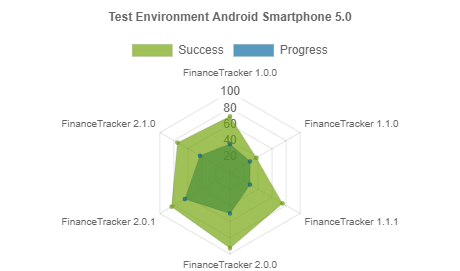
The Test Environment Overview Report shows the success and progress rate of systems under test under a single test environment in a radar chart. If fewer than three systems under test are configured, a bar chart will be displayed instead.
The following properties of the “Test Environment Overview” report diagram are configurable:
![]() Only available in Klaros-Testmanagement Enterprise Edition
Only available in Klaros-Testmanagement Enterprise Edition
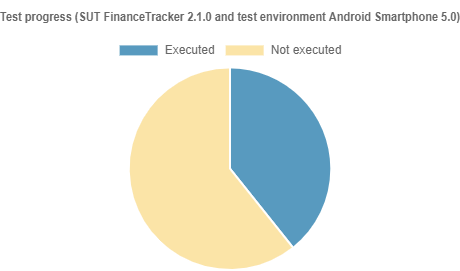
The Test Progress report shows the rate of executed versus defined test cases of a project for a given set of test environments and test systems.
The following properties of the “Test Progress” report diagram are configurable:
![]() Only available in Klaros-Testmanagement Enterprise Edition
Only available in Klaros-Testmanagement Enterprise Edition
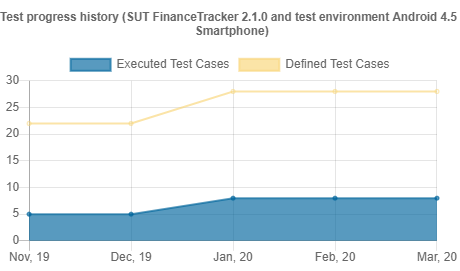
The Test History report shows the rate of defined test cases versus executed test cases for a project for one or more test environments and one or more systems under test in a given time period.
The following properties of the “Test Progress History” report diagram are configurable:
|
|
|
|
| 8.5. Import Test Results |  |
9.2. Reports |