| 11.5. Creating a Chart | ||
|---|---|---|

|
Chapter 11. Custom Reports |  |
| 11.5. Creating a Chart | ||
|---|---|---|
|
|
Chapter 11. Custom Reports | |
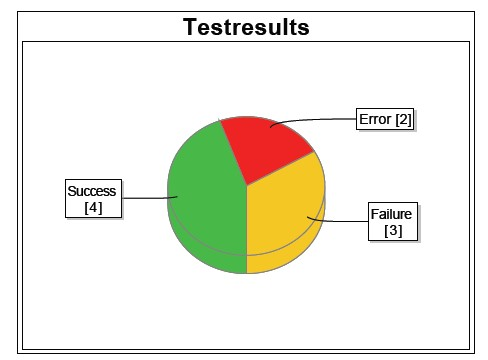
Reports can be enhanced by providing a chart showing a graphical representation of the data retrieved. The data for these charts is also prepared by the report script and stored in the context. The layout template passed the data to the charting component of SeamPDF. This section explains how to create a pie chart as shown in Figure 11.7, “Pie Chart Example”.
The report script is not only used to retrieve the data, but also be to prepare the data for the
layout template.
The following snippet shows a way to prepare the data for a pie chart.
For each possible result type, an empty List object is created.
Then the de.verit.klaros.core.model.KlarosTestCaseResult objects
retrieved before are added to one of the lists depending on their result verdict.
These lists can then later be accessed from the context by their corresponding key.
  List<KlarosTestCaseResult> error = new ArrayList<KlarosTestCaseResult>();
  List<KlarosTestCaseResult> failure = new ArrayList<KlarosTestCaseResult>();
  List<KlarosTestCaseResult> success = new ArrayList<KlarosTestCaseResult>();
  // Iterate over the results and retrieve the status
  Iterator<KlarosTestCaseResult> iter = (Iterator<KlarosTestCaseResult>) tcr.iterator();
  while (iter.hasNext()) {
    KlarosTestCaseResult result = iter.next();
      if (result.isError()) error.add(result);
      else if (result.isFailure()) failure.add(result);
      else if (result.isPassed()) success.add(result);
  }
  context.add("error", error);
  context.add("failure", failure);
context.add("success", success);The following snippet shows the chart using the data that has been prepared by the report script in the previous section.
  <p:paragraph horizontalAlignment="center">
    <p:piechart title="Test Results" direction="anticlockwise" circular="true"
      startAngle="30" labelGap="0.1" labelLinkPaint="#000000" plotBackgroundPaint="#ffffff"
      labelBackgroundPaint="#ffffff" is3D="true">
      <p:series key="results">
        <p:data key="Error [#{error.size}]" value="#{error.size}" sectionPaint="#FF0A0A" />
        <p:data key="Success [#{success.size}]" value="#{success.size}" sectionPaint="#33CC00"/>
        <p:data key="Failure [#{failure.size}]" value="#{failure.size}" sectionPaint="#FFCC00"/>
      </p:series>
    </p:piechart>
  </p:paragraph>
The piechart element defines the presentation and contents of the chart.
For a pie chart a series element is required.
The data is retrieved from the lists formerly stored in the context by the script.
<p:data key="Error [#{error.size}]" value="#{error.size}" sectionPaint="#FF0A0A" />
This code retrieves the list containing the results from the context and calls
its size() method to determine the number of test cases.
The pie chart is then rendered, using the three data sections, as seen in
Figure 11.7, “Pie Chart Example”.
![[Note]](images/note.png) |
Note |
|---|---|
|
For detailed information on different chart types, please check the SeamPDF documentation. |
This section shows how to include an image into a report. To be accessible by the report template, the image file has to be stored in one of two possible locations:
.klaros/resources folder
When storing the image in a .jar file, it can be accessed using the following code snippet.
<p:image value="images/image.png"/>
The value attribute defines the image filename and the folder
of the image location inside the jar file.
When providing an image via a URL it can be accessed using the following code snippet.
  <p:html>
    <img src="http://www.verit.de/images/logo-klaros-160.png" />
  </p:html>
The src attribute defines the URL of the image location.
This section shows how to build an Excel report template for Klaros-Testmanagement. For detailed information please refer to SeamExcel manual. More information on the Klaros-Testmanagement object model can be found in de.verit.klaros.core.model.
The following snippet shows a basic Excel report template. The <e:workbook> element, contains all other report details.
  <e:workbook xmlns:e="http://jboss.org/schema/seam/excel"
    xmlns:f="http://java.sun.com/jsf/core" xmlns:ui="http://java.sun.com/jsf/facelets">
        <e:worksheet name="#{user.name}" value="#{testCases}" var="testCase">...
        </e:worksheet>
  </e:workbook>
Note the usage of the de.verit.klaros.core.model.KlarosUser
and the de.verit.klaros.core.model.KlarosTestCase
parameter from the context: #{user.name} and
#{testCases}.
A worksheet uses a list of objects to generate the rows and columns of the Excel sheet.
This list must be passed to the value
attribute of the worksheet element.
In the var attribute, the name of the current object can
be defined.
For example: To use the test case name of the current object inside the worksheet block,
the statement #{testCase.name} is used.
It is also possible to use multiple worksheet
elements in one template, though in this example only one worksheet is used, with the username as the
worksheet name.
|
|
 |
|
| 11.4. Example Report |  |
Chapter 12. Import/Export |