| 11.3. Example Report | ||
|---|---|---|

|
Chapter 11. Custom Reports |  |
| 11.3. Example Report | ||
|---|---|---|
|
|
Chapter 11. Custom Reports | |
This section provides an example report, which shows how to retrieve test case results and how to display them depending on their status.
The following code snippet shows the frame for a Groovy script with the required imports. The code to retrieve the data must be implemented in the execute method. A more detailed description of the Klaros-Testmanagement API can be found in de.verit.klaros.core.model.
  import de.verit.klaros.scripting.*;
  import de.verit.klaros.core.model.*;
  import java.util.*;

  public class TestScript implements KlarosScript {

    public void execute(KlarosContext context) {...
    }
  }
The next step in the data retrieval process is to actually get the required data. The following code snippet shows how to build a query string and how to get the data.
  StringBuffer query = new StringBuffer();
  query.append("select tcr from KlarosTestCaseResult tcr");
  List<?> tcr = context.executeQuery(query.toString());
The data is returned in a List
object that must be stored in the context so that it can later
be accessed from the report template.
The code snippet below shows how to store the list in the context.
For more information on building queries please consult the HQL documentation.
context.add("results", tcr);
The List
object is stored in the context with the name results and can be accessed
from the report template by this name.
If more data is required, execute more queries to retrieve the data or
process the already retrieved data and store the processed data in the context with a
different name.
![[Note]](images/note.png) |
Note |
|---|---|
|
It is possible to store more than one object in the context. Just use a different name for each object. |
The code snippets presented in this section show how to build a report template for Klaros-Testmanagement. For detailed information please refer to SeamPDF manual. More information on the Klaros-Testmanagement object model can be found in de.verit.klaros.core.model.
The following snippet shows how to build the frame for the report template. Inside this frame all other Report details can be described and grouped in chapters and sections.
  <p:document xmlns:ui="http://java.sun.com/jsf/facelets" xmlns:f="http://java.sun.com/jsf/core"
   xmlns:p="http://jboss.org/schema/seam/pdf" title="Klaros-Testmanagement Test Suite Report"
   marginMirroring="true" author="#{user.name}" creator="#{user.name}" pageSize="A4">...
  </p:document>
Note the usage of the de.verit.klaros.core.model.KlarosUser
parameter from the context, #{user.name}.
The next code snippet shows how to define headers and footers for all pages in the report. This snippet makes use of the date and the de.verit.klaros.core.model.KlarosUser object in the context.
  <f:facet name="header">
    <p:font size="8">
      <p:header borderWidthBottom="0.1" borderColorBottom="black" borderWidthTop="0" alignment="center">
        <p:text value="Example report - generated #{date} by #{user.name}"/>
      </p:header>
      <p:footer borderWidthTop="0.1" borderColorTop="black" borderWidthBottom="0" alignment="center">
        <p:text value="Page " />
        <p:pageNumber />
      </p:footer>
    </p:font>
  </f:facet>
Next the front page for the report should be defined to provide a short summary of the report. To keep this example short only a fragment is presented. For the complete script please see Section E.3, “Example ”.
  <p:font style="bold" size="16">
    <p:paragraph alignment="center" spacingAfter="5">
      <p:text value="#{user.name} (#{user.email})"/>
    </p:paragraph>
  </p:font>
The snippet shows how to insert the user's email address which opens the email client when clicked.
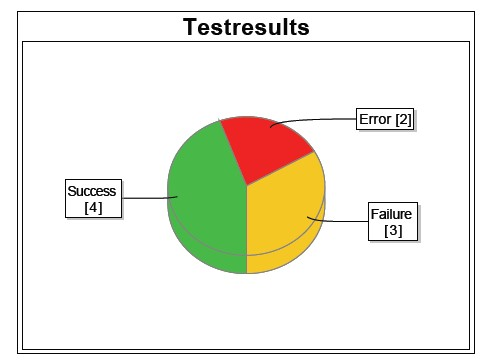
To provide a graphical overview it is sometimes necessary to add a chart to the report. The required data can be prepared by the Groovy script and stored in the context. Then the report template can pass the data to the charting component of SeamPDF. This section explains how to create a chart as shown in Figure 11.7, “A Pie Chart Example”.
As mentioned before, the Groovy script is not only used to retrieve the data, but it
can also be used to prepare the data for the report.
The following listing shows a possible way to prepare the data for a pie chart.
For every possible result a List object is created, then the
de.verit.klaros.core.model.KlarosTestCaseResult
retrieved before are stored in one of the lists depending on the test result. Next the
lists are added to the context.
  List<KlarosTestCaseResult> error = new ArrayList<KlarosTestCaseResult>();
  List<KlarosTestCaseResult> failure = new ArrayList<KlarosTestCaseResult>();
  List<KlarosTestCaseResult> success = new ArrayList<KlarosTestCaseResult>();
  // Iterate over the results and retrieve the status
  Iterator<KlarosTestCaseResult> iter = (Iterator<KlarosTestCaseResult>) tcr.iterator();
  while (iter.hasNext()) {
    KlarosTestCaseResult result = iter.next();
      if (result.isError()) error.add(result);
      else if (result.isFailure()) failure.add(result);
      else if (result.isPassed()) success.add(result);
  }
  context.add("error", error);
  context.add("failure", failure);
  context.add("success", success);
The de.verit.klaros.core.model.KlarosTestCaseResult are split into three lists depending on the test case result. These lists can then be accessed from the context by their corresponding key.
The following snippet shows how to display the data that was prepared by the Groovy script before.
  <p:paragraph horizontalAlignment="center">
    <p:piechart title="Testresults" direction="anticlockwise" circular="true"
      startAngle="30" labelGap="0.1" labelLinkPaint="black" plotBackgroundPaint="white"
      labelBackgroundPaint="white" is3D="true">
      <p:series key="results">
        <p:data key="Error [#{error.size}]" value="#{error.size}" sectionPaint="#FF0A0A" />
        <p:data key="Success [#{success.size}]" value="#{success.size}" sectionPaint="#33CC00"/>
        <p:data key="Failure [#{failure.size}]" value="#{failure.size}" sectionPaint="#FFCC00"/>
      </p:series>
    </p:piechart>
  </p:paragraph>
The piechart element builds the frame for the chart by defining
the main outlook of the chart. For detailed information on different charts please check the
SeamPDF
documentation. For a pie chart a series of data is required. The data is retrieved
from the lists stored in the context by the Groovy script.
<p:data key="Error [#{error.size}]" value="#{error.size}" sectionPaint="#FF0A0A" />
This code retrieves the list containing the error results from the context and calls
its size() method to determine the amount of erroneous test cases.
The pie chart is then rendered from the three datasections, as seen in
Figure 11.7, “A Pie Chart Example”.
This section shows how to include an image into a report.
Since the report is rendered by Seam, the image to be included must be accessible from
Seam. This can either be achieved by storing the image in a .jar file and storing
this file in the .klaros/resources folder of the user running Klaros-Testmanagement,
or by providing the image on a web server, from where it can be included by using HTML
code in the report template.
When storing the image in a .jar file it can be easily accessed by the following code snippet.
<p:image value="images/image.png"/>
The value attribute defines the image filename and the folder
of the image location.
When providing an image via a web server it can be accessed by the following code snippet.
  <p:html>
    <img src="http://www.verit.de/images/logo-klaros-160.png" />
  </p:html>
In this case the
src
attribute defines the URL of the image location.
The code snippets presented in this section show how to build a report template for Klaros-Testmanagement. For detailed information please refer to SeamExcel manual. More information on the Klaros-Testmanagement object model can be found in de.verit.klaros.core.model .
The following snippet shows how to build the frame for the report template. Inside this frame all other report details can be described and grouped in chapters and sections.
  <e:workbook xmlns:e="http://jboss.org/schema/seam/excel"
    xmlns:f="http://java.sun.com/jsf/core" xmlns:ui="http://java.sun.com/jsf/facelets">
        <e:worksheet name="#{user.name}" value="#{testCases}" var="testCase">...
        </e:worksheet>
  </e:workbook>
Note the usage of the de.verit.klaros.core.model.KlarosUser
and the de.verit.klaros.core.model.KlarosTestCase
parameter from the context, #{user.name} and
#{testCases}.
A worksheet uses a list of objects to generate the rows and columns of the excel sheet.
This list must be passed to the value
attribute of the worksheet tag. In the
var attribute the name of the current object can
be defined. For example: To use the test case name of the current
object inside the worksheet block the statement #{testCase.name}
must be used.
It is also possible to use multiple worksheet
tags in one template. In this example we have only one worksheet with the user name as
worksheet name.
|
|
 |
|
| 11.2. Applying a Report Template |  |
Chapter 12. Import/Export |